

When you roll over the timeline on a YouTube video, you see a gray graph that shows the most watched parts. This is called the Engagement Graph or Viewership Graph (I call it a Sparkgraph). It’s a visual representation of how viewers interact with the video over time, with the peaks indicating the most popular sections.
It’s pretty handy. Watch a 3-hour baseball game on YouTube, you can easily find the highlights.
But sometimes that Engagement Graph isn’t all that accurate.
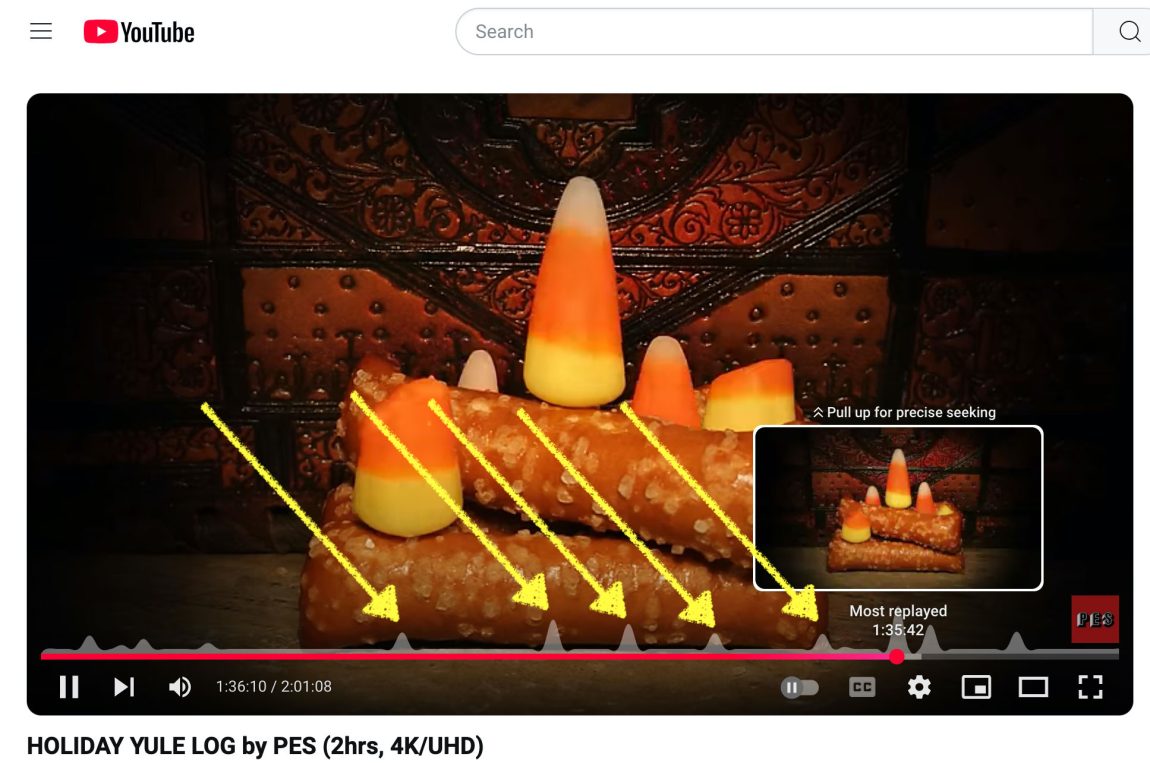
Take this two-hour animation of a candy corn ablaze in a fireplace. This cute video is a simple loop that goes over and over. Certainly, in two hours, there’s got to be sort of Easter egg that happens, right? Maybe Santa comes down the chimney.
Roll over the Engagement Graph, and you’ll see some spikes.
I checked out the spikes. Nothing different happens. It’s the same loop. It’s just people clicking the same spikes that other people did because other people clicked it.
This is a statement on human behavior.
1. Herd Mentality
We have a tendency to follow the crowd, even if it doesn’t make sense. If one person clicks a specific point on the timeline, others may be more likely to do the same, creating a false sense of popularity. This behavior is rooted in our social nature and our desire to conform to group norms. It’s seen in various aspects of life, from fashion trends to political opinions. (Funny to think of fashion trends as people clicking the same spot on a sparkgraph.)
2. Confirmation Bias
People tend to seek out information that confirms their existing beliefs or expectations. If someone sees a spike in the Engagement Graph at a particular point, they may be more likely to believe that something significant happens there, even if it’s not true. This bias can lead to echo chambers and reinforce existing prejudices. It’s important to be aware of this tendency and to seek out diverse perspectives.
3. Curiosity
Humans are naturally curious and often drawn to novelty. If a spike in the Engagement Graph suggests that something interesting happens at a certain point, people may be curious to see what it is, even if it’s just a random event. This behavior is driven by our desire to learn and explore. It’s what motivates us to seek out new experiences and knowledge.
4. Social Proof
People are more likely to do something if they see others doing it. If a large number of people have clicked a particular point on the timeline, it creates a sense of social proof that it’s worth watching. This behavior is often used in marketing and advertising. By showing that many people are using a product or service, businesses can encourage others to follow suit.
5. Random Chance
Sometimes, people simply click on random points on the timeline out of boredom or habit. This can create false spikes in the Engagement Graph, especially for longer videos. This behavior is a reminder that not all human behavior is intentional or meaningful. Sometimes, people do things simply because they can.
The random chance part reminds me a bit of how traffic jams happen with the Ripple Effect. A single car braking suddenly can trigger a chain reaction, causing cars behind it to brake as well.
Next time you see a spike, consider if it’s genuine intrigue or just the herd mentality at play.